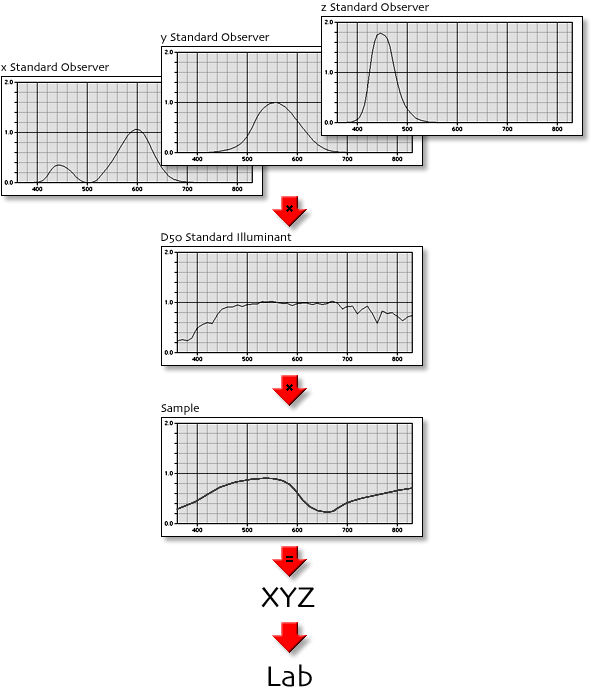
The Lab gamut has a strange appearance and makes one wonder what it is and how it is made. The best place to start is a quick review of how a single Lab color is made. The spectral reflectance of a color sample is integrated with the CIE Standard Observer functions and a Reference Illuminant. This produces an XYZ tristimulus. The conversion from XYZ to Lab is given by a standard CIE formula.

For the gamut shown in the images, the CIE 2° Standard Observer functions, and the CIE D50 Reference Illuminant were used. Furthermore, the samples chosen were limited to non-fluorescing materials (i.e. the reflectance at any wavelength is limited to the range [0.0, 1.0]).
So the only variable is the Sample spectrum. There are infinitely many spectra, but just suppose you generated them all, and for each, you computed its Lab values and plotted this point in the three-dimensional Lab coordinate system. What you would find is that these points would form a cluster, and that the cluster would have a definite shape, and that the shape would have a definite boundary beyond which no Lab points would ever be generated. That boundary is the Lab Gamut that is shown in the images.
The illustrations were rendered using a proprietary ray tracing program. The gamut surface is modeled using 10,247 ellipsoids which lie just inside the gamut boundary. This causes the surface to appear "bumpy" (it is not) and the seams to be ragged (they are not), but perhaps contributes to the ability to "see" the shape better.
3D gamut extent surfaces are most easily computed by using only those colors found on the surface (i.e. exclude interior colors). For theoretical RGB color spaces, these are the colors where at least one of the red, green, blue components is either 0.0 or 1.0. For the Lab gamut, the colors on the surface must be computed spectrally. The spectra of the surface colors are those obtained by passing square pulses through the conversion from spectrum to XYZ (and possibly further calculations, such as XYZ-to-Lab). To explain the spectral pulses, here is a simple explanation using only 10 spectral samples across the visible spectrum.
First use a single pulse:
    1 0 0 0 0 0 0 0 0 0

    0 1 0 0 0 0 0 0 0 0

    0 0 1 0 0 0 0 0 0 0

    etc.

    0 0 0 0 0 0 0 0 0 1
Then use a double, with wrap-around:
    1 1 0 0 0 0 0 0 0 0

    0 1 1 0 0 0 0 0 0 0

    0 0 1 1 0 0 0 0 0 0

    etc.

    0 0 0 0 0 0 0 0 1 1

    1 0 0 0 0 0 0 0 0 1
Then use a triple:
    1 1 1 0 0 0 0 0 0 0

    0 1 1 1 0 0 0 0 0 0

    0 0 1 1 1 0 0 0 0 0

    etc.

    0 0 0 0 0 0 0 1 1 1

    1 0 0 0 0 0 0 0 1 1

    1 1 0 0 0 0 0 0 0 1
And so on. Here is the last pulse:
    1 1 1 1 1 1 1 1 1 0

    0 1 1 1 1 1 1 1 1 1

    1 0 1 1 1 1 1 1 1 1

    etc.

    1 1 1 1 1 1 1 1 0 1
In practice, you will need to use more than 10 samples. I used 0.25 nm increments in my illustrations, which means the 10 changes to 1480. You will get lots of Lab points from this, and they will not be evenly spaced. The points may be joined together to make a polyhedron of triangles, which is a mathematical description of the surface that can be used to compute the volume.
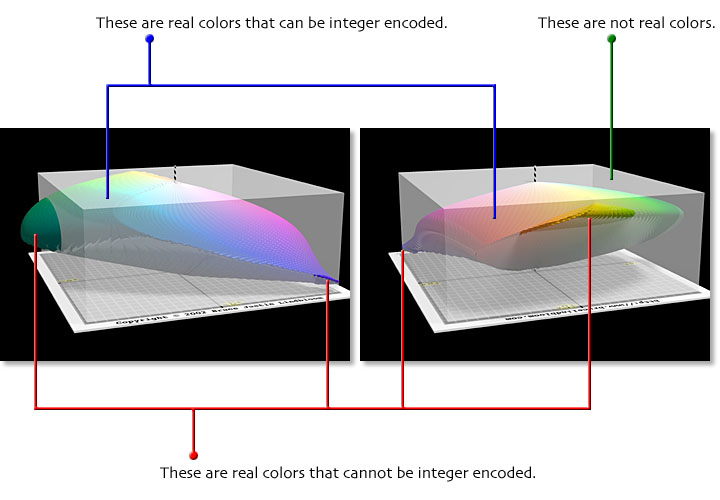
Many real world implementations of Lab encode the values as integers. Common examples include TIFF image files, ICC profiles and Adobe Photoshop images. Integers have limited ranges. Typically, the full L* range [0, 100] is encoded. However, the encoding range of the a* and b* components is usually restricted to cover the range [-128, 127]. Therefore, all possible Lab colors cannot be encoded using this scheme. Even when 16-bit values are used instead of 8-bit values, the extra bits are used to make finer divisions between values, and are not used to extend the range of values.
Here is an illustration showing the limits imposed by this integer encoding of Lab:

The semi-transparent boxes show the portion of Lab color space that may be represented by integer encoding. You can see that some real colors are excluded (the lobes that bulge outside the box). You can also see that much of the available encoding space, about two-thirds in fact, is wasted because these Lab values can never occur.