This set of images is useful in making objective, color reproduction determinations of a profile. The test patterns are in Lab color mode, thus only a single profile is needed in order to render them. This is a better situation than one which also involves a source profile, since in that case, the source profile might contribute to reproduction errors.
General Description of the Images
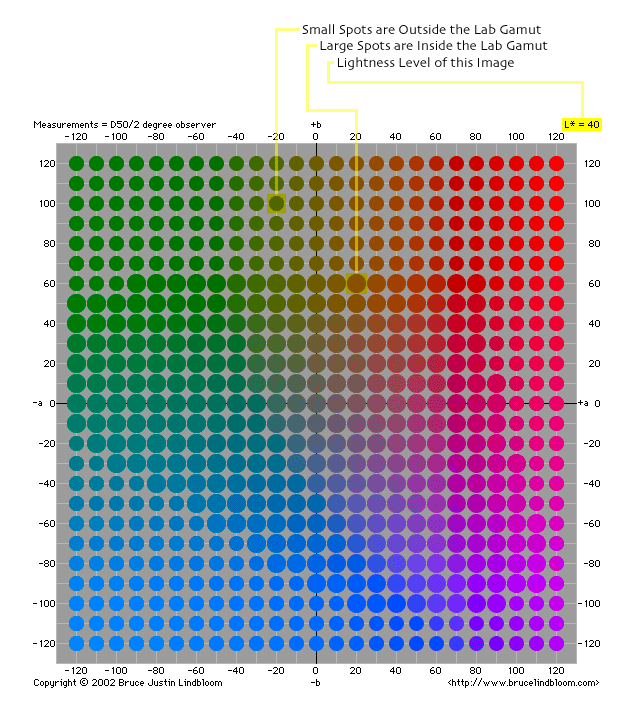
This is a set of eleven Lab TIFF images. Each image represents a single L* value, spanning the range of L* = {0, 10, 20, ..., 90, 100}. Within each image, an array of spots appears, covering the a*/b* plane for that lightness level (the lightness level for each image appears in its upper right corner). These spots are also conveniently located on even multiples of 10. Some of the spots are large and others are small. The large spots represent colors that are inside the Lab Gamut. The small spots represent colors that are outside the Lab Gamut.
Lab Gamut
The Lab Gamut described here relates to reflective, non-fluorescing colors. In such an environment, a sample color will reflect anywhere between 0 percent and 100 percent of the incident light at each wavelength. It cannot reflect less than zero, nor more than 100 percent. Given this, all possible reflectance spectra are bounded by zero and 100, across the visible spectrum. If one took the infinite set of all possible spectra that conform to these restrictions and measured them with a spectrophotometer (2-degree observer, D50 reference illuminant), a set of Lab triplets would be produced. The collective set of all such measurements, when plotted as points in three-dimensional Lab color space, would occupy a finite volume which would have a rather irregular shape. This volume is what I call the Lab Gamut. There are many possible Lab triplets that are outside this gamut, and therefore could never possibly result from an instrument measurement of a physical color sample. An example is Lab = 10, -100, 100. More information on the Lab Gamut, including pictures, may be found here.
How To Use the Test Patterns
Each of these test patterns should be printed (or displayed) using a profile with Absolute Colorimetric rendering intent. The resultant rendition may then be measured with a spectrophotometer to determine the color accuracy of the profile. Note that the printed spots will fall into three categories (1, 2a, 2b):
How do you distinguish between cases 2a and 2b? You may use Adobe Photoshop to view the Lab TIFF files relative to the profile, and then make note of the out-of-gamut warning.
The images are available as downloads in either zip (645K) or sit (791K) format. The download includes a Read Me file that explains everything.